Data only matters if it changes what we do instructionally.
It is the central theme of day one of The Reading League’s 2026 Summit: From Confusion to Clarity: Turning Data Into Instructional Impact.
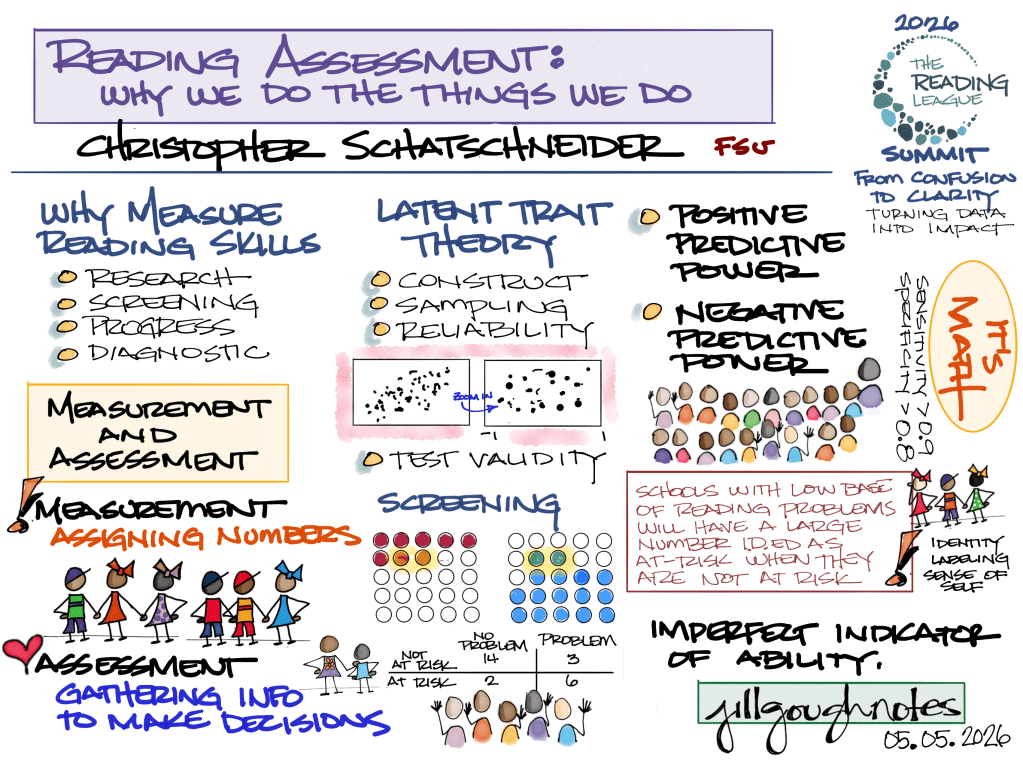
Keynote: Reading Assessment: Why We Do The Things We Do
Dr. Chris Schatschneider
Dr. Schatschneider opened with a distinction that sounds simple and isn’t:
Assessment ≠ measurement.
Measurement assigns a number. Assessment interprets that number to make a decision. When we confuse those two things, treating a score as the full story, we risk doing kids a disservice. Every reading assessment is a sample, not a complete picture. We’re measuring latent traits, skills we can’t directly observe, so every score is an estimate. That doesn’t make data useless. A test can be reliable (it consistently ranks students the same way) and still imprecise (scores shift depending on the passage). Screening tells us about probability, not destiny. “At risk” does not mean a child will struggle. “Not at risk” does not mean a child will not struggle. Base rates matter. Context matters. Our school’s specific population matters.
He also carefully walked us through sensitivity and specificity, how well our screeners catch kids who need support without flooding intervention rosters with kids who don’t. And he made a compelling case for Computer Adaptive Testing as a more efficient and precise alternative to traditional screeners.
Here’s the bottom line: there is no perfect assessment. We must use multiple data points and interpret results in context. Always ask: What instructional decision does this data help me make?
Panel 1: Taking Action on Classroom Data
Matt Burns, Tiffany Hogan, Sarah Siegal, and Margaret Goldberg
Margaret Goldberg opened with: “We have to rethink what we believe about reading, data, and instruction.” She laid out the belief shift plainly. Many of us still carry the idea that standardized data is inauthentic, that real assessment means listening to a child read aloud or matching them to a book, that reading develops naturally through exposure. The evidence tells a different story. Roughly 40–50% of students need systematic, explicit code-focused instruction, and another 10–15% need intensive, highly repetitive support. Most students do not learn to read simply by being in a literacy-rich environment. Her charge: use data proactively to predict difficulty, group by need, and adjust instruction before a student falls further behind. “Tests are tools.” “We are looking for warning signs of reading difficulty.” “We’re attempting to change trajectories.” “We adjust teaching in response to the data.” We are not just observing reading. We are trying to prevent reading failure.
Matt Burns challenged us to consider: if a large portion of your students are struggling, that’s a Tier 1 problem, not a student problem. Before we start building individualized plans, we should be asking whether our core instruction is doing what it needs to do.
Tiffany Hogan brought language comprehension to the center. Developmental Language Disorder affects roughly 1 in 10 students, and we often miss it because we simply aren’t assessing language. We measure decoding. We don’t always measure vocabulary, sentence comprehension, or a student’s ability to retell. Her critical insight: many “late reading problems” are actually late-identified language problems.
Sarah Siegal grounded it all in instruction. Differentiation, she reminded us, is about doing the right type of instruction for the right students. Code-focused instruction is significantly more effective in small groups. Meaning-focused instruction is more flexible and can be delivered in whole-group settings. Knowing the difference shapes how we structure our time and our people.
Panel 2: Taking Action on Student Data
Sarah Brown, Lillian Durán, Jessica Toste, Mark Shinn
Analysis does not equal action. We can look at and talk about data all day. The question is whether we leave the table with a clear answer to: What will we do differently tomorrow?
Sarah Brown pushed hard: we spend too much time analyzing data and not enough time acting on it. When teams leave a data meeting having explained what the numbers show but without a clear instructional move, the conversation isn’t finished. She challenged us to take up three questions for teams to ask every time: What question are we trying to answer? What evidence do we need? What action will we take?
Lillian Durán made an equity argument: screening in only one language gives us an incomplete, and often misleading, picture of what a student actually knows. Language knowledge is distributed across the languages a student speaks. When we don’t account for that, we risk over-identifying students who don’t need intervention and under-identifying students who do.
Jessica Toste helped us think about matching the grain size of data to the decision we’re making. Classroom data guides daily teaching. Progress monitoring tells us if a student is growing. Screening identifies who might be at risk. These serve different purposes, and mixing them up leads to confusion and poor decisions. Again: What question are we trying to answer? What evidence do we need? What action will we take?
Mark Shinn made the case for Oral Reading Fluency as a powerful progress-monitoring tool, and a commonly misused one. ORF is quick, standardized, and predictive of overall reading success. A caution: one score means almost nothing. A pattern over time tells you everything. His point: ORF is a general outcome measure, not a diagnostic tool. The question is whether a student is improving and whether the intervention is working. When teams treat ORF as a one-time snapshot or over-interpret small fluctuations, they’re asking it to do a job it wasn’t designed for.
Workshop 1: Which data point for which decision and why?
Adrea Truckenmiller
Part I of Adrea Truckenmiller’s workshop started with: which data point for which decision, and why? She opened with a language choice that matters more than we acknowledge. Low scores are not a fixed fate. We are measuring malleable skills and strategies, not stable traits. Universal screening tells you who is at risk. Diagnostic tools tell you what a student needs. Progress monitoring tells you whether instruction is working. The breakdown happens when we use them interchangeably. Her questions for any data team: What does overall class performance look like? How many students are at risk, in which skills, and at what intensity? How do we strengthen classroom instruction to actually target gaps? And… how will we know if it’s working?
Day One wasn’t really about assessment tools or data systems. It was about moving from collecting data to using data to make instructional decisions that actually change student outcomes.
Using data to make better instructional decisions that change student outcomes.
Data only matters if it changes what we do instructionally.
