What happens when a whole number task stops being a whole number task?
On Wednesday, November 18, our 4th-, 5th-, and 6th-grade math teachers gathered in the Multi-Purpose Room for our face-to-face numeracy session. Our learning targets kept us anchored in the work we have been doing all fall:
- I can focus on retrieval practice for multiplication fluency.
- I can plan activities that help students become fluent mathematicians.
This post is the next chapter in our multiplication fluency story. In Multiplication: Knew It Right Away, or Figured It Out? A team approach to fluency, I shared how our teams assess fluency and why speed is not the goal. In Multiplication: What I Know, What I Need to Learn, I shared what students see in their own data and how that data shaped our asynchronous session on November 4. Wednesday’s face-to-face session picked up right where those posts left off.
We spent the hour doing math together, looking at our data, and sharing the routines and games we have been learning from Figuring Out Fluency: Multiplication and Division With Whole Numbers by Jennifer Bay-Williams and John SanGiovanni. And every classroom went home with new tools for making products visible.
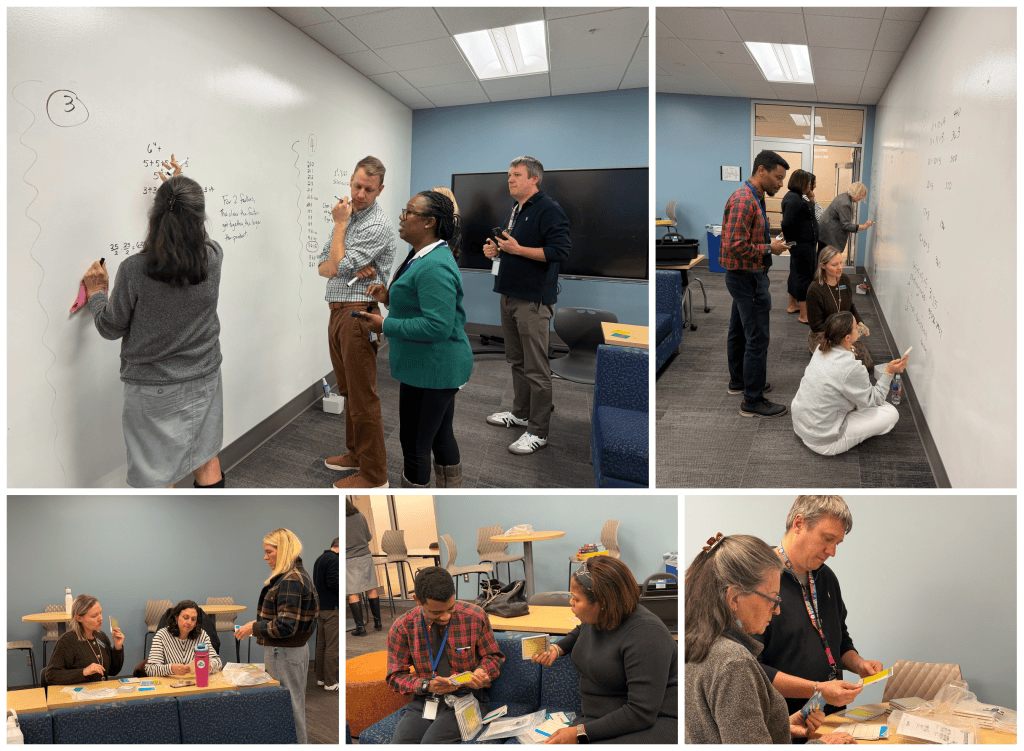
Building Thinking Classrooms Task: Split 25
We opened with a curricular task:
Give me numbers that sum to 25. Find the product of these numbers.
What is the largest product you can make?
Teams went straight to the vertical whiteboards, and the thinking was visible within minutes. Most groups started with whole numbers and a few friendly decompositions.
- 20 + 5 gives 20 × 5 = 100
- 10 + 10 + 5 gives 10 × 10 × 5 = 500
- 11 + 11 + 3 gives 11 × 11 × 3 = 363
- 5 + 5 + 5 + 5 + 5 gives 5⁵ = 3,125
Then the noticing started. One team wrote a conjecture on the board for everyone to see: For 2 factors, the closer the factors get together, the larger the product. Other teams tested it with more parts. If equal parts make the biggest product, how many equal parts should we use?
That question pushed everyone past whole numbers. Two equal parts means 25/2 × 25/2 = 625/4, or 156.25. Ten equal parts means 2.5¹⁰, which is about 9,536.74. Suddenly we were multiplying fractions and decimals, comparing products, and arguing about which representation made the comparison easiest. (Want to keep going? Try nine equal parts and see what happens.)
This is exactly what we want for our students. A task that starts in comfortable territory, invites conjectures, and naturally stretches into fractions, decimals, and exponents. The ones doing the talking are the ones learning, and the room was loud.
Making Products Visible
Split 25 raised a question every upper elementary teacher knows well. How do we help students see what happens when we multiply fractions and decimals, instead of just following a rule?
Every 4th-, 5th-, and 6th-grade classroom explored and received two new sets of thinking tools:
- Fraction Model Multipliers Activity Set: five student sets of dry-erase blue cards and transparent yellow overlays for 1/2, 1/3, 2/3, 1/4, 3/4, the fifths, the eighths, and 1 whole, plus 50 task cards.
- Decimal Model Multipliers Activity Set: five student sets of blue cards and transparent yellow overlays for tenths from 0.1 to 1.0, plus 50 task cards that include 30 word problems. Products land in hundredths.
The idea is beautifully simple. Lay one overlay across a card at a right angle, and the overlapping region is the product. Place 3/4 over 2/3, and you can see six of twelve equal parts covered, so 3/4 × 2/3 = 6/12. Place 0.4 over 0.3, and you can count 12 hundredths, so 0.4 × 0.3 = 0.12. Why is the product smaller than both factors? Students can see why before anyone tells them.
This connects directly to the multiplication work we have been doing all fall. Our students build arrays and area models for whole number facts. These sets extend that same area model into fractions and decimals, so the representation grows with the mathematics. Teachers paired up to try the task cards, and the questions came quickly.
What Does Our Data Tell Us?
Every teacher has entered their Multiplication Retrieval Practice data, so we have a complete, up-to-date picture together. As I wrote in Part 1, our teams look beyond accuracy. Accuracy shows what students can do, confidence shows what they believe, and our leveled assessment shows how deeply they understand. On every problem, we ask students two separate questions: Did you know it right away, or did you figure it out? And how confident are you?
As I wrote in Part 2, students can also see their own data. Their fact tables show what they know in green and what they need to learn in white, and after each assessment they write a short practice list. White cells are not failure. They are a specific, manageable next step.
Our goal is for every student to reach Level 3 on our leveled retrieval practice: I can find factor pairs of a number. That is about more than speed. It is about fluency, flexibility, and long-term memory, the agile numeric thinking students will need for algebra. Level 4 then asks students to solve a problem more than one way and build a clear argument.
The task, Split 25, made a nice bridge here. Breaking 25 into parts and comparing products is factor thinking in action, and defending a conjecture about which product is largest is Level 4 thinking. Working backward from a product to its factors is exactly the kind of flexibility we want to keep building with spaced and distributed retrieval practice.
Learning is the constant; time is the variable. Our data helps us decide where to spend that time.
Sharing Routines and Games
So what do students do with those practice lists? Part 2 ended with that question, and our November 4 asynchronous session was our answer. Each teacher picked up a copy of Figuring Out Fluency, read the opening of Part 3: Putting It All Together (pp. 166–167), and signed up to learn one activity well enough to teach it to the team.
| Activity | Name | Type |
|---|---|---|
| F.1 | Strategize First Steps | Routine |
| F.2 | M-A-K-E a Decision | Routine |
| F.3 | Share-Share-Compare | Routine |
| F.4 | Strategy Spin | Game |
| F.5 | Just Right | Game |
| F.6 | Strategories | Game |
| F.7 | Make a Product | Game |
| F.8 | A-MAZE-ing Race | Game |
| F.9 | Strategy Problem Sort | Center |
I love this structure. Instead of one person presenting nine activities, nine people each became the expert on one. Teachers learned the activity, practiced it with a small team, and then shared it with colleagues. Now our teams share a toolkit that goes well beyond worksheets.
These routines and games matter because practice should build strategies, not just repetition. Remember the student in Part 2 who mixed up 54 and 56? Drilling 7 × 8 = 56 one more time is not the fix. Rebuilding it from 7 × 7 or 6 × 9 from 6 × 10 is. The games give students many low-stakes, high-engagement ways to retrieve facts and choose strategies, spaced over time, so the white cells on their fact tables keep turning green.
Where We Go Next
What strikes me most about this session is how the pieces fit together. A rich task invited conjectures. The conjectures pushed us into fractions and decimals. The Model Multipliers gave us a way to see those products. Our data reminded us why flexibility with factors matters. And the routines and games from Figuring Out Fluency gave us ways to keep practicing, a little at a time, over time.
A few questions I am carrying forward:
- How might we use Split 25, or a task like it, to surface student conjectures in our own classrooms?
- Where will the Fraction and Decimal Model Multipliers fit best: as an entry point, a way to justify thinking, or both?
- Which routine or game will you try first, and what will you look for in student thinking?
Thank you, 4th-, 5th-, and 6th-grade teams, for leaning into math with such curiosity. And thank you for entering your Multiplication Retrieval Practice data. Because all classroom data is in, we can plan next steps for each student.

